
**Updated Data as of 08/31/2020**
- What goes into a decision?
- How does this change depending on if it is a good decision or a bad one?
- How does this change if it is reversible or not reversible?
That’s a lot to think about – some decisions are like that. A lot has been written, read, stated, shared around decision making.
Here are a couple of considerations to help improve your decision making.
To Decide or Not To Decide
“If You Choose Not to Decide, You Still Have Made a Choice” – Rush
Let’s start, as usual, with a definition – what does it mean to “Decide”?
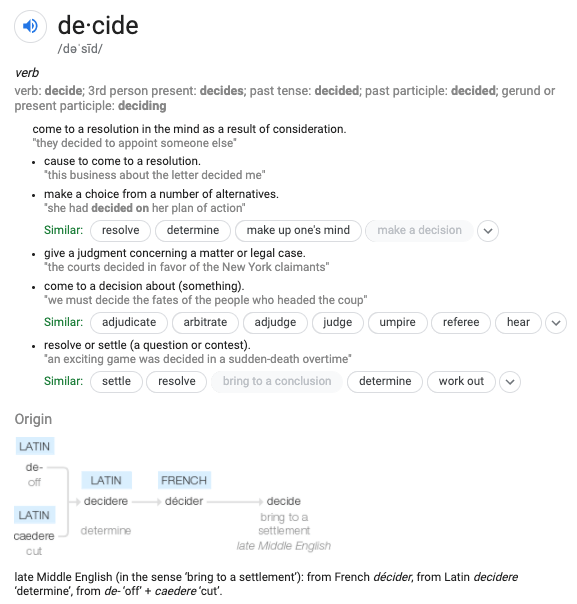
How does this change when thinking about the word “Decision”
Net/Net – a Decision is something that requires or comes from, consideration. Depending on the type of decision we are making this consideration, deliberation, evaluation may be deep or surface level.
So – how can we deliberate, or consider things in the process of making a decision?
Frameworks for Decision Making
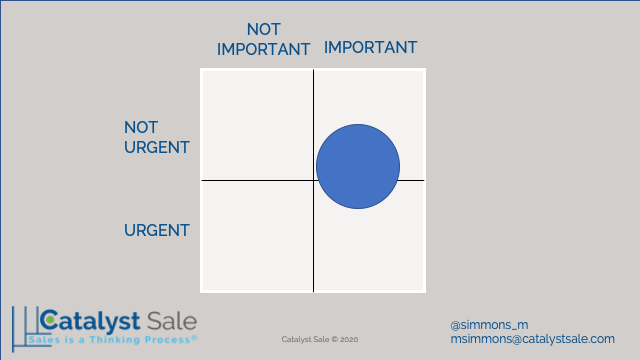
Frameworks are models, tools, systems that we can use to create organization. They are adaptable yet they provide structure. A framework like a traditional Eisenhower Box/Matrix or Franklin T, will not make the decision for you. A solid framework can help provide guidelines, boundaries, and structure.
One of my favorites is the 2×2 or Eisenhower Matrix. Eisenhower used this tool to determine if he should do something, delegate something, eliminate something, or determine if additional deliberation is needed.
Another framework you can use is the Franklin T – most folks know about this as a traditional Pro/Cons list, For or Against, etc.
Bain created the RAPID® Decision Making Tool. Lt. Col. John Boyd created the OODA Loop (another personal favorite) – Observe, Orient, Decide, Act.
“Chance Favors the Prepared Mind”
Louis Pasteur
There are no shortage of frameworks that you can use or apply to Decision Making, it is helpful to pick one though. By picking one, and sticking to it, you can make decisions that are more predictable, and not left up to chance. As they say “Chance Favors the Prepared Mind” (Louis Pasteur) – prepare yourself with the proper framework.
Thinking Through Your Decisions
- How well do you think?
- What type of thinking are you applying to a given situation?
- Have these questions provoked some thought?
I hope so.
Thinking is important to me, heck, it is in our tagline for the business “Sales is a Thinking Process®”. I wonder sometimes though, are we really thinking, or are we simply reacting? Are we leveraging our OODA loop to observe and orient before we decide?
Don Pontefract has been a guest on the podcast before – his book “Open to Think” is phenomenal. He talks about three types of Thinking.
- Creative – “Do You Reflect?” (consider)
- Critical – Decide (do) – How are you making that decision? (do/do not)
- Applied – The commitment to take action on something you have decided. (Commit)
In the following post I share some questions that can help us avoid some of the challenges associated with thinking, and some that can help us be more aware.
“Be a journalist in your research & your thinking”
Mike Simmons
How do I think about thinking? Well, it all starts with a question, and most of the time those questions have some iteration of the words – Who, What, Why, Where, When, and How. Be a Journalist in your research & your thinking and asking questions.
Bias – It Happens – Be Aware of It
- What is Bias?
- What are some common Biases?
- How can we avoid them?
Bias is a prejudgement.
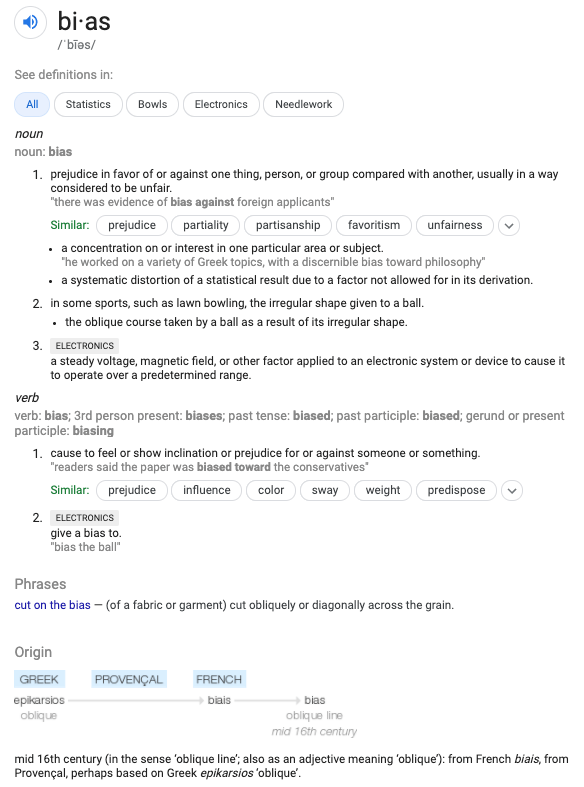
“Prejudice in favor of or against…” Think about it – bias starts with pre-judging. Whether fair or unfair – if we prejudge things – we allow pre-conceived notions to potentially get in the way of our perspective.
This creates blindspots. Blindspots create risk.
You might have a bias toward action – meaning when things are broken you want to fix them. When folks are in trouble, you want to help. When you see a problem, you move into solution mode. You might have a bias toward not acting. You might listen better, wait to respond, consider all aspects.
These biases may change depending on circumstances. Think of the challenges with thinking, how might the impact of bias change when you are in a high stress situation, or you are under a tight clock?
Some of My Favorite Biases
Confirmation Bias – “the tendency to gather evidence that confirms preexisting expectations, typically by emphasizing or pursuing supporting evidence while dismissing or failing to seek contradictory evidence.”
Recency Effect a memory phenomenon in which the most recently presented facts, impressions, or items are learned or remembered better than material presented earlier. This effect can occur in both formal learning situations and social contexts. For example, it can result in inaccurate ratings of a person’s abilities due to the inordinate influence of the most recent information received about that person. Also called law of recency; principle of recency; recency error.
Consistency Motive – the desire to confirm one’s current beliefs about one’s self, including experimentally induced beliefs. Self-consistency strivings are thought to minimize discomfort associated with disjunctions between different aspects of self-knowledge. Compare self-assessment motive; self-enhancement motive. See also self-verification motive.
Fundamental Attribution Error – in attribution theory, the tendency to overestimate the degree to which an individual’s behavior is determined by his or her abiding personal characteristics, attitudes, or beliefs and, correspondingly, to minimize the influence of the surrounding situation on that behavior (e.g., financial or social pressures). There is evidence that this tendency is more common in some societies than in others. Also called correspondence bias; over attribution bias.
The Fundamental Attribution Error is my personal favorite. Think about it this way – you are walking down the street – you see someone walking toward you, they trip over a stick. You think “clutz”. Now what happens if you tripped over the same stick? Is your default thought – “clutz” or “dang stick”?
So What?
Let’s talk about Decision Making, Thinking, and Bias in the context of data, and more specifically in the context of COVID-19.
This is going to be challenging – two expectations I will set.
- I will not make, give, or share an opinion.
- It’s really tough to find good data.
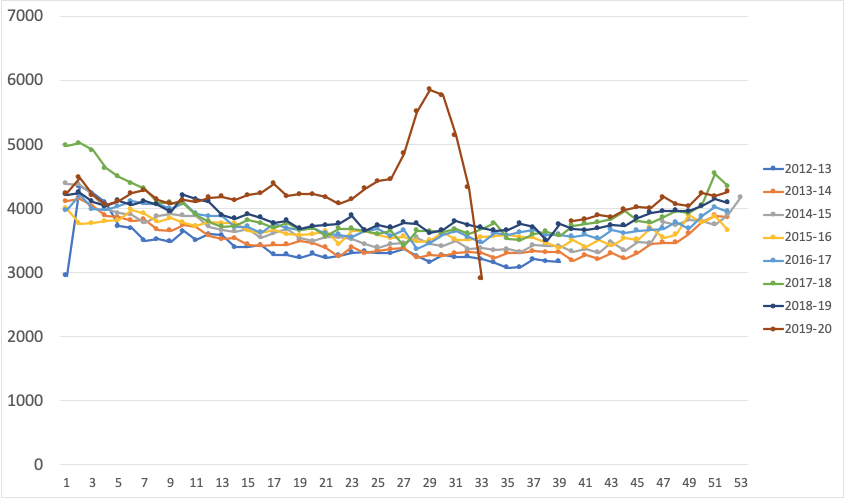
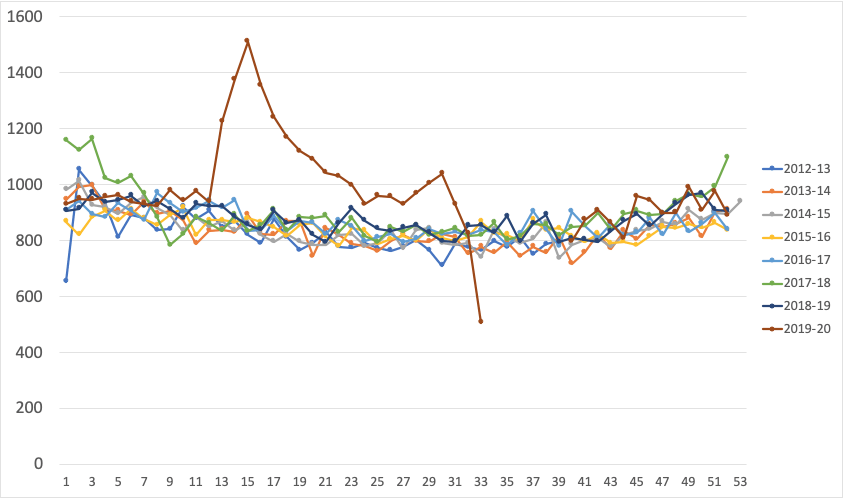
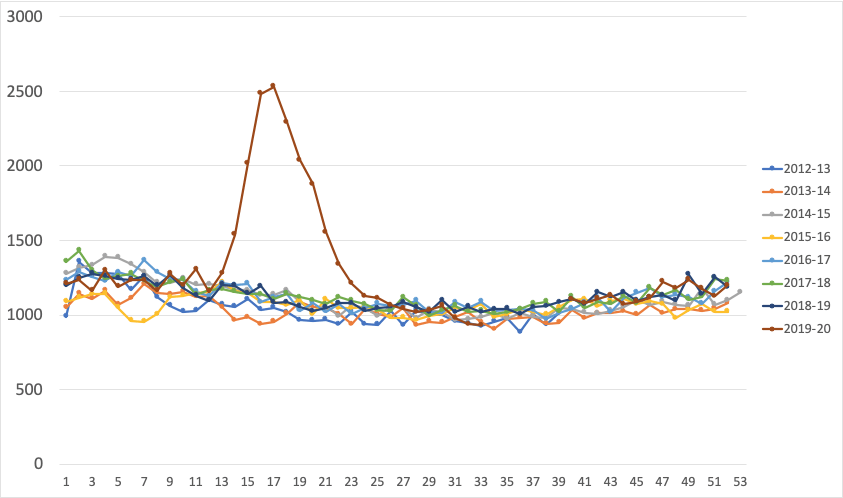
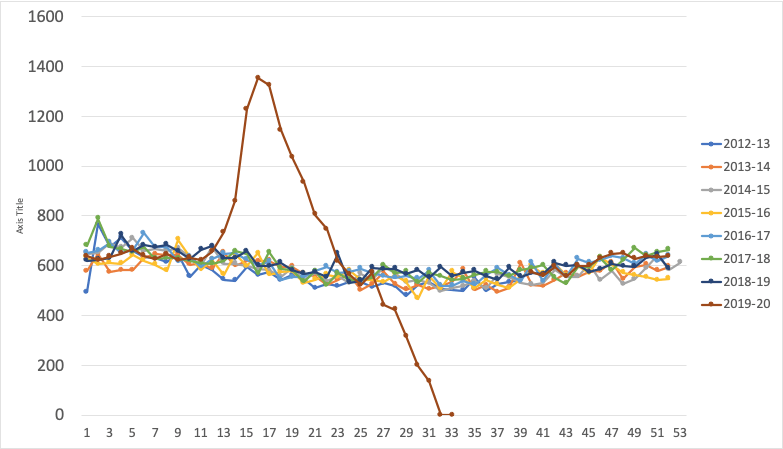
Data – What’s the source?
The source of the following data is from the CDC, the charts were built using pivot-tables in excel. I will also include some screenshots of data from the Johns Hopkins Coronavirus Resource Center, and data compiled by the NY Times shared via their GitHub folder. All links are provided.
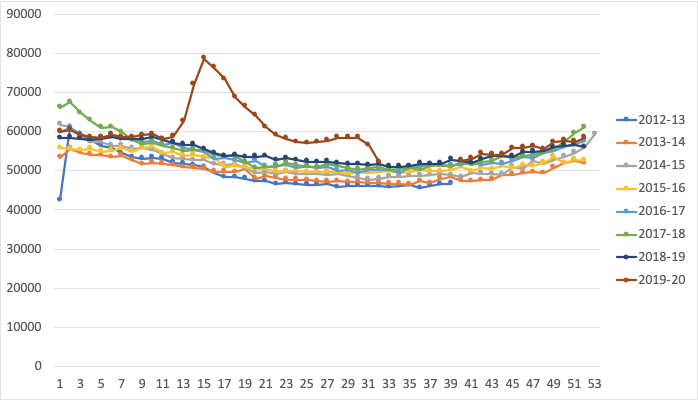
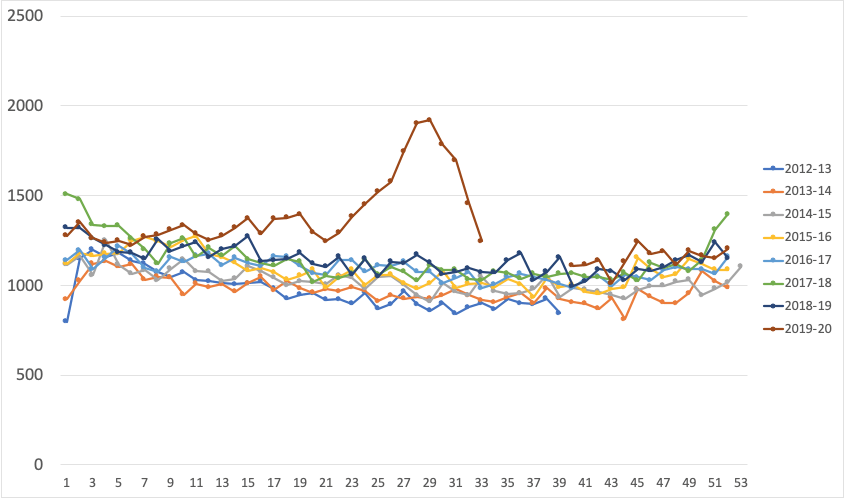
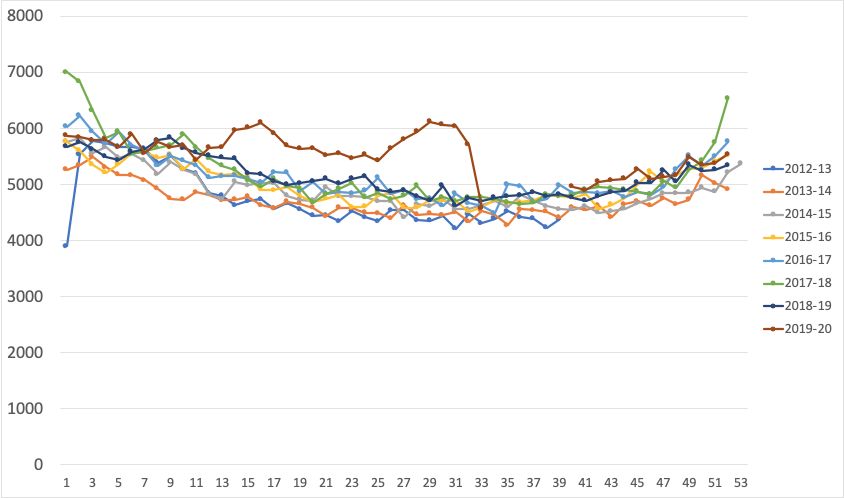
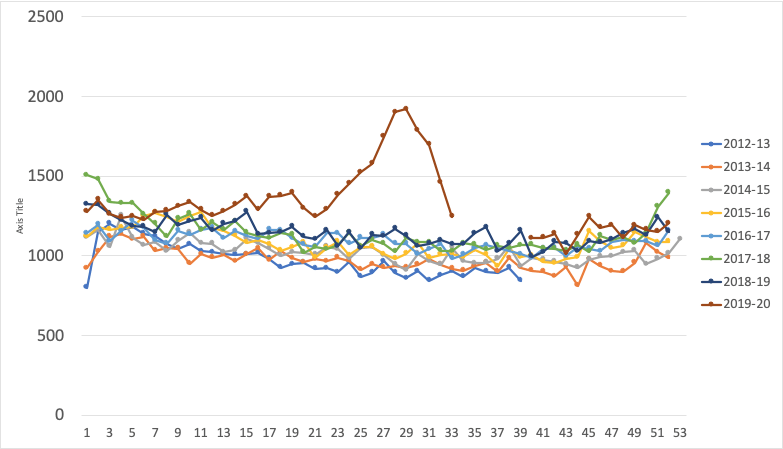
The CDC data is all-cause mortality data – all deaths, by week, separated into flu-seasons. The data used in this post is as of the 5th of July 2020, the reported data is through week 24 of 2020. The CDC Data is completed approximately 4 weeks after actual week of the year.
In other-words, it takes about 4 weeks before the data is 100% reported by each state/region. I will periodically update the data.
Why All-Cause Mortality Data? – well, the way that deaths are reported could insert some type of bias. If we look at all deaths, we should remove that bias. Death is binary.
If you’d like a copy of this data sent to you, along with any additional updates I create – please register here.
The data the CDC compiled here is through Week 33 of 2020. (We are currently in week 37 of 2020)
Arizona Data – August 31, 2020
California Data – August 31, 2020
Washington State Data – August 31, 2020

Texas Data – August 31, 2020
NY & NY City Area Data – August 31, 2020

New Jersey Data – August 31, 2020

Michigan Data – August 31, 2020

Louisiana Data – August 31, 2020
Massachusetts Data – August 31, 2020
Connecticut Data – August 31, 2020
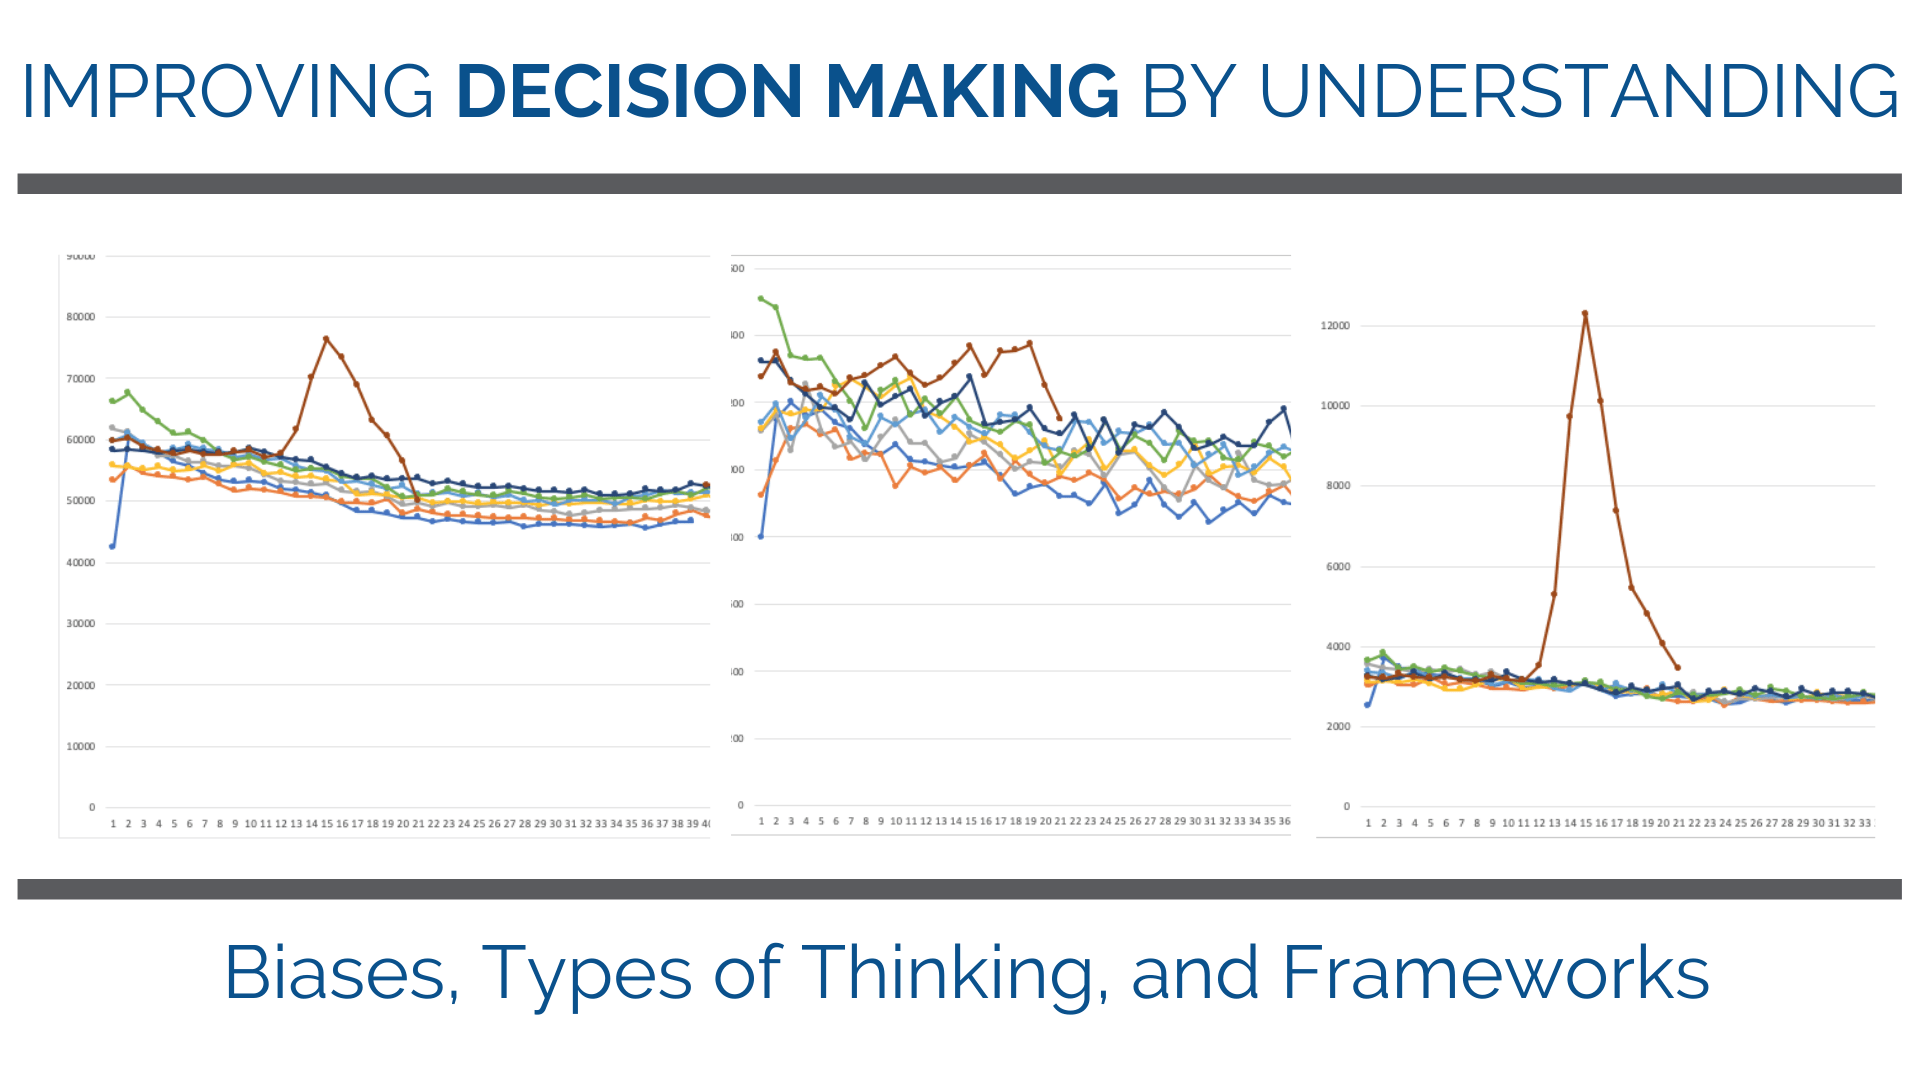
Some more AZ Data – via the Clinical Testing Laboratory at Arizona State University
This data was pulled on 07/05/2020 from this site – https://biodesign.asu.edu/research/clinical-testing/critical-covid-19-trends
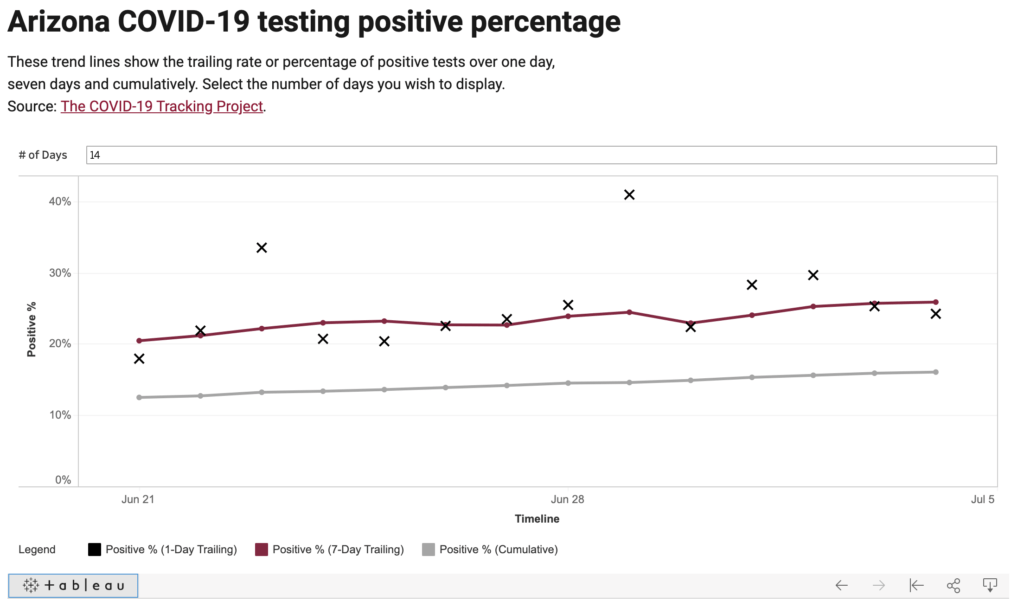
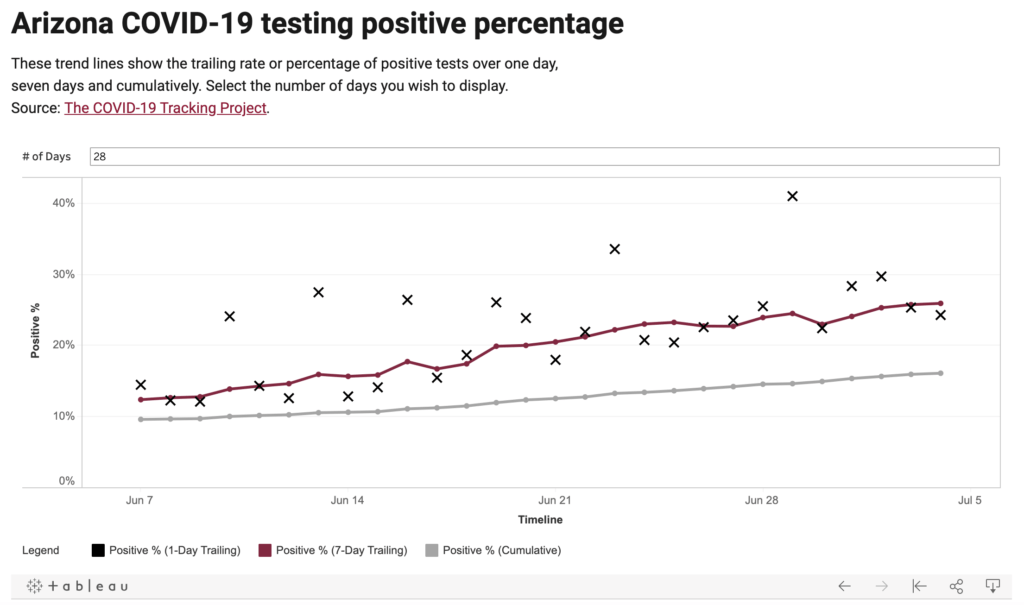
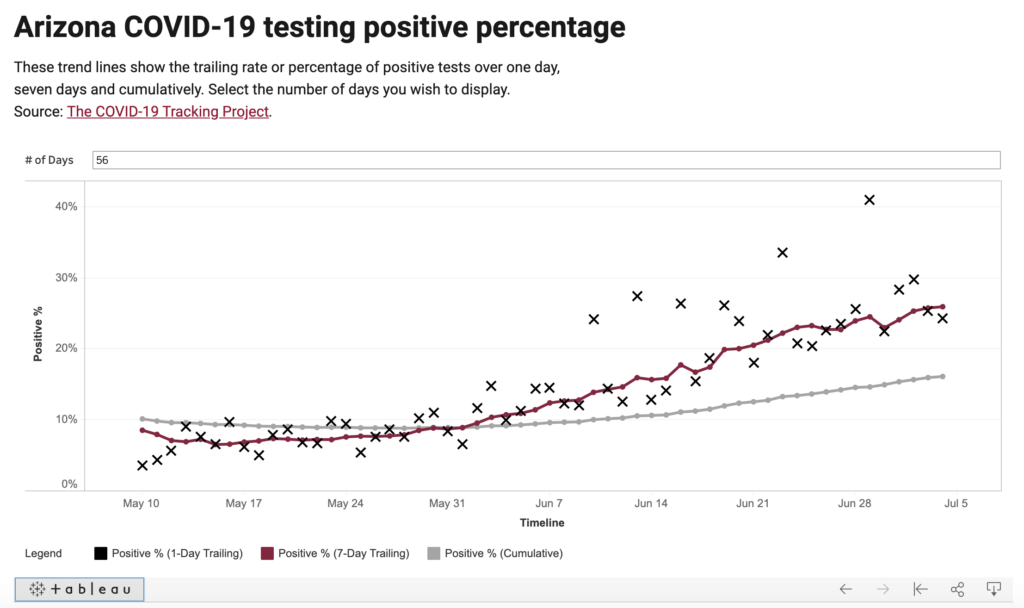
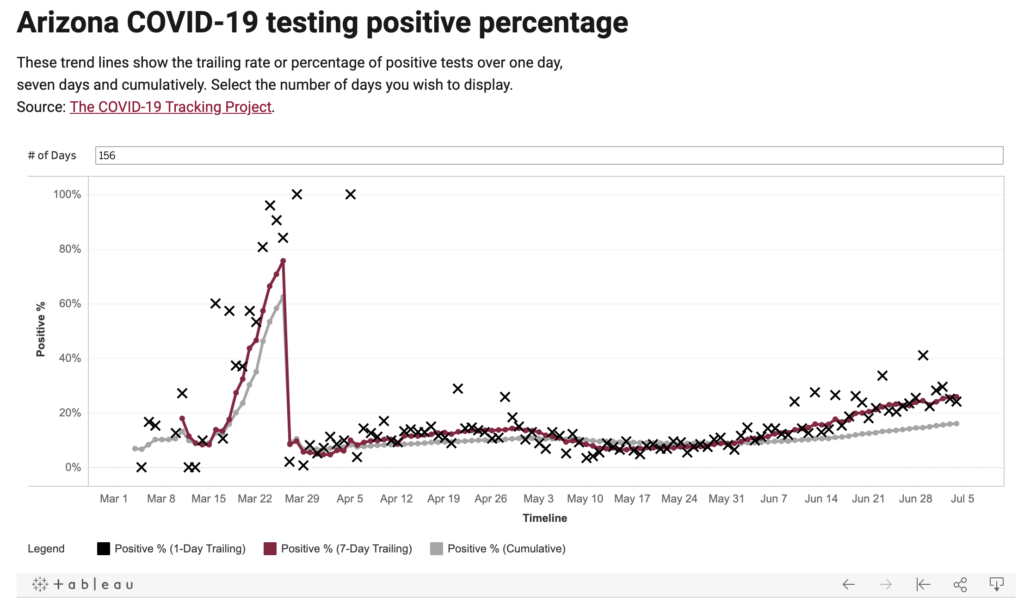
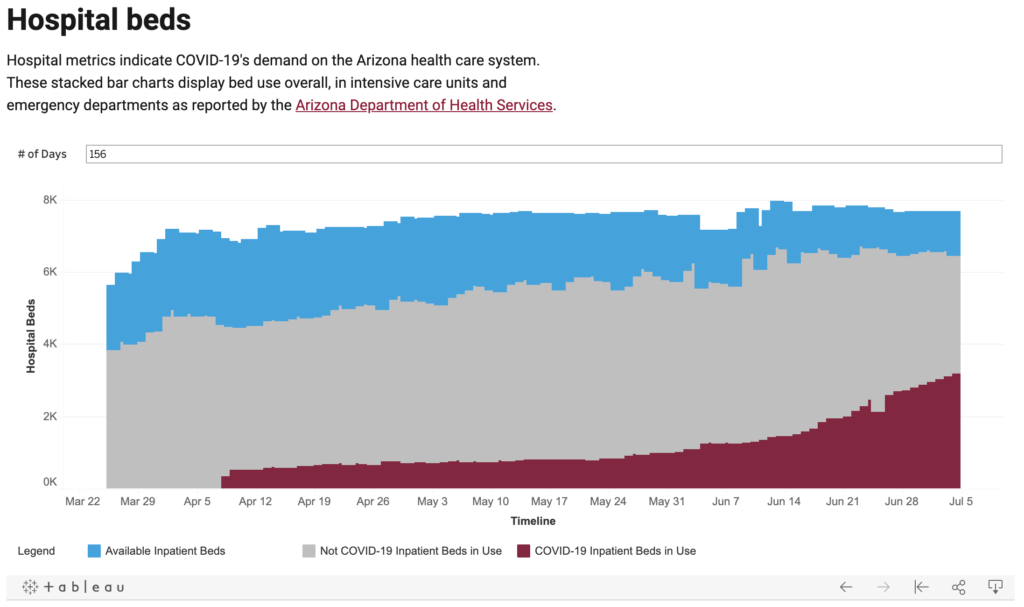
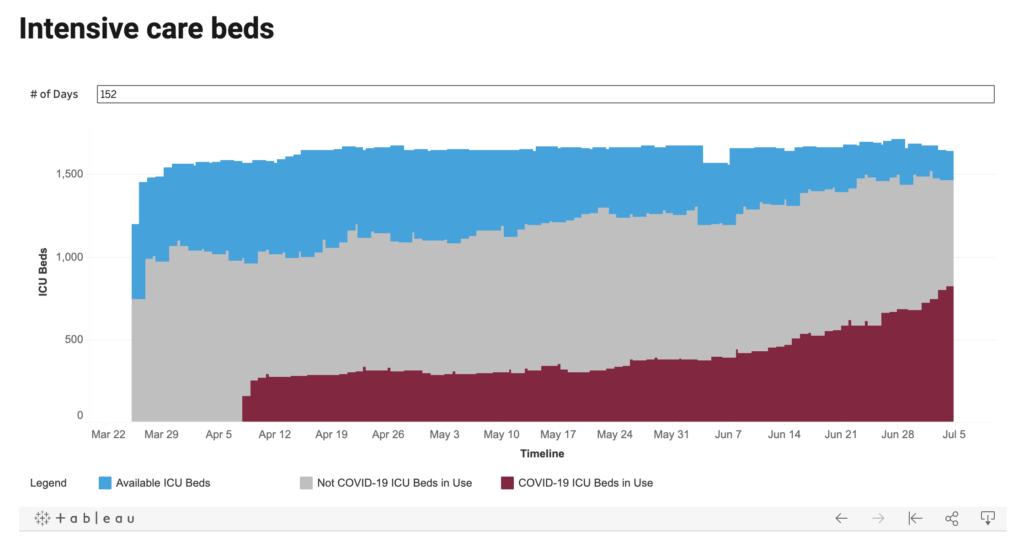
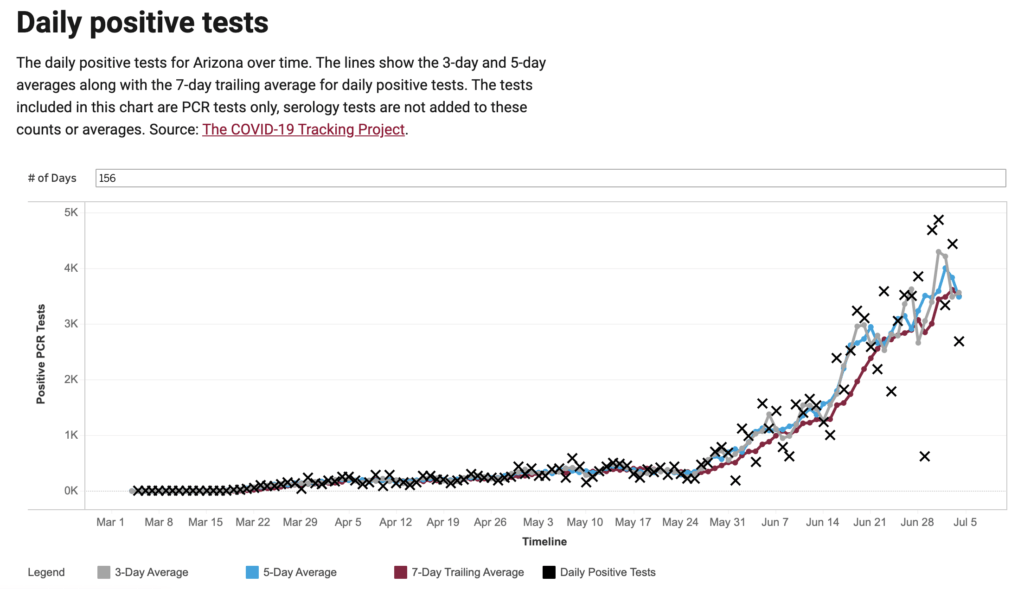
When looking at the AZ specific data – what do you see? What do you expect to see?
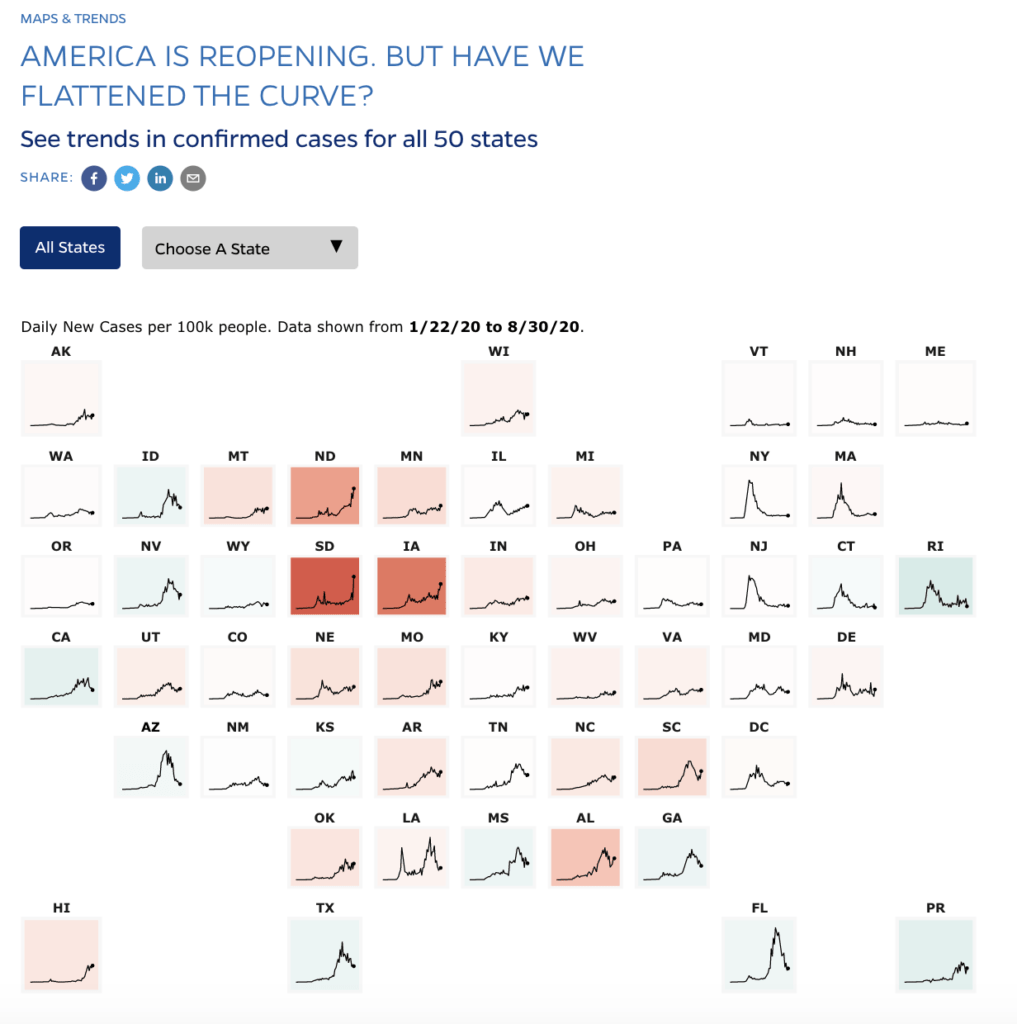
New York Times Data
The following data is current through 08/31/2020 is linked via the ASU COVID-19 Critical Trends site. The direct link follows the chart.
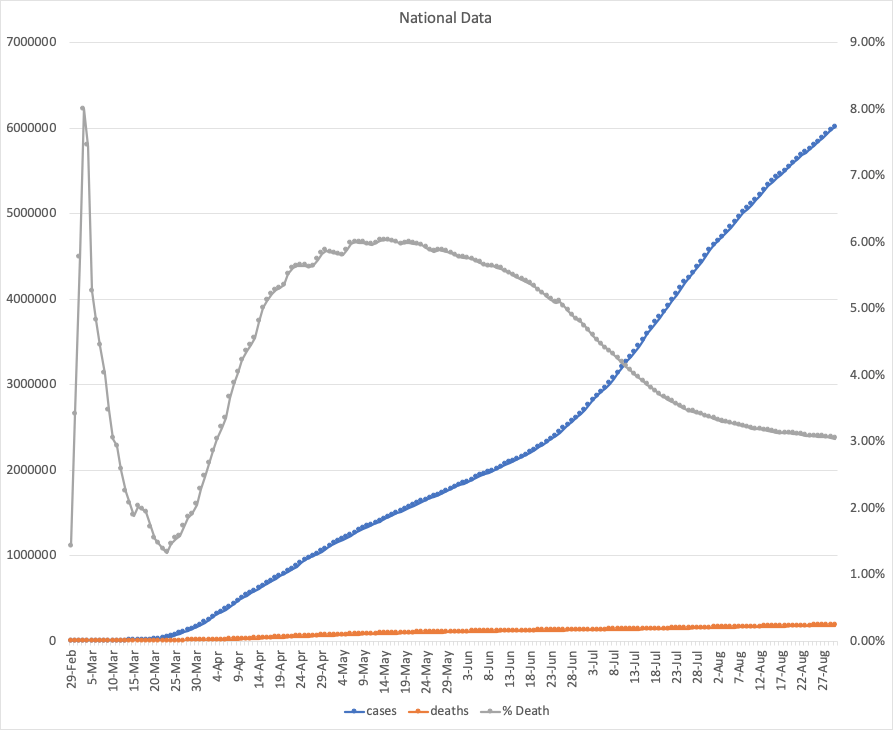
For cases and deaths data: Coronavirus data in the United States, The New York Times
That’s a bit of Data Overload – So What?
There seems to be a correlation between some states that saw a spike in COVID-19 cases based on the JHU 3-day moving average daily confirmed cases data, and those states that saw an increase in reported deaths.
Some states were hit significantly harder than other states.
It also seems like some states were not really hit at all, relative to year over year changes in mortality.
Mortality stopped in the state of Connecticut recently – I’m not sure why.
The catalyst for me looking into the data was that it also seemed like the primary data being shared in the media was focused on those states hit the hardest.
If we only looked at NY, MA, NJ, IL, MI data – it would be a bit biased. If we only looked at CA, AZ, WA, TX data – that would be a bit biased as well.
Why might folks share biased data? Why might we look for the data that reinforces our perspective?
These are just a couple of interesting questions to consider.
What’s Next
Data can be used to tell whatever story you might like it to tell. Which reminds me of the Mark Twain quote “lies, damn lies, and statistics”
When you are faced with a decision…
- Know what type of decision you are making.
- Identify the framework you will use to make or inform the decision.
- Apply the correct type of thinking to the data, information, etc.
- Be aware of the biases that might be influencing or impacting you.
Thanks for reading this – I’d love to hear how you are thinking differently about decision making.